In this activity area measurement was done using two ways, by Green’s theorem and by counting the pixels.
What is Green’s Theorem? Mathematical definition: It is a vector identity that relates the line integral of a closed contour C with the surface integral of the enclosed space D by the contour. The theorem is described by the equation
 where it is integrated over the closed contour
 ![]() . Translating it to it’s Discrete form (below), this can now be used to calculate the area via the pixels in a contour. This is going to be used later in the activity.
. Translating it to it’s Discrete form (below), this can now be used to calculate the area via the pixels in a contour. This is going to be used later in the activity.
Recalling from the second activity/entry (Scilab Basics), we learned how to generate an image of a circle. For this activity, the scilab code was used to generate a 4×4 image with a circle at the center having a radius 0f 140. Theoretically, obtaining its area using the formula
A_circle = pi*r^2,
It has a value of 61544 (pixels). The generated image is shown below. For some unknown reason, saving the image to .bmp via Scilab saves it to a 256 color bitmap image. This makes the image an indexed image and not a binary one. So I had to convert it to a 24 bit bitmap image using paint to make it binary.
Figure 1. Image of a circle generated via Scilab
Now, since I am using the recent version of Scilab and the SIVP toolbox, the follow() function which is necessary for the activity can’t be used. This is because it is found in the SIP toolbox, which happens to function only in Scilab’s older version. So I decided to install the older version and the SIP toolbox as well. Good thing that both versions of Scilab can be used simultaneously. But after installing, an error still occurs when linking SIP to Scilab. Fortunately, Dr. Soriano had a solution written in her blog. After following the additional instructions, it worked. hurrah! 🙂
So, SIP’s follow() function extracts the parametric contours of binary object. It basically obtains the pixel coordinates of the shape’s edges. The imread() function reads the image into an image matrix. Since this is a binary image, the matrix is of the form MxNx1. It is important that it is a binary image because the follow function only reads two values: 1 for the object and 0 for the background.
I = imread('C:\Users\user\Documents\AP186\activity 4\circle.bmp');
[x, y] = follow(I);
plot (x,y)
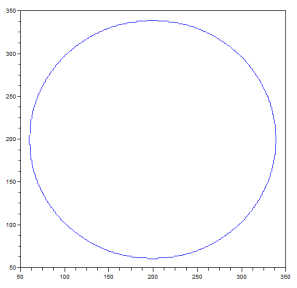
The pixel coordinates were assigned as x and y as shown in the 2nd line . Then plotting the coordinates gave the trace of the circle’s edge.
Figure 2. Plotted pixel edge coordinates of the shape
The equation in Green’s theorem is used in the code below.
xshift=[x;x(1)];
xshift(1) =[];
yshift=[y;y(1)];
yshift(1) = [];
A_circle = 0.5*(sum((x.*yshift)-(y.*xshift)));
The area of the circle that the program outputs is 60865. Obtaining the percent error of the circle’s area using the equation, Percent error = {|(measured – actual)|/actual}*100%, gives the value of 1.39%. This can be accounted from the smoothness of the edge curvature of the circle.
An application of area measurement via image processing is Remote sensing (e.g. estimating a land area). I decided to measure the land area of the first ever wonder of the world, the Great Pyramid of Giza! 🙂
Fun fact: It is also known as the Pyramid of Khufu, the largest of the three pyramids in Egypt. It was constructed for 20 yrs in the 2,560th BC. The first and the oldest of all the seven wonders of the world. 🙂
Figure 3. Snapshot of Great Pyramid of Giza as shown in Google map
Above is the aerial view of the pyramid as shown in Google map. The image was obtained using Snipping tool. The area of interest is only the base of the pyramid as shown by the lime colored square in the image below.
Figure 4. Highlighted area of interest/pyramid base for area estimation
Using Paint, the area of interest was delineated from the rest of the background by setting the pyramid’s area as white and the background black. It was saved as a 24-bit Bitmap image.
Figure 5. Separating the area of interest/pyramid base (white) from the background (black)
Using the same code, the x and y pixel coordinates of the pyramid base is plotted (shown below). The area computed is 47,080 (square pixels). Using Paint, the pixel coordinates of the edges were noted and used to compute the area. It was verified that indeed the area is 214 x 220, the same as the analytically computed area.
Figure 6. Plotted pixel edge coordinates of the area of interest/pyramid base
In Google map, the absolute scale reads 100 m for every 2.2 cm in a ruler. The measured dimensions of the pyramid base using a ruler was 5 cm x 5cm. Using ratio and proportion, the computed actual dimension of the pyramid base is 227 m x 227 m. So the actual area is 51,651 square meters. The percent error is 8.8%. This can be accounted to the precision in delineating the pyramid’s base area. Nevertheless, the magnitude of error is relatively small. Therefore, area estimation is still accurate. 🙂
I would like to thank Zaldy for sharing a copy of the installer of Scilab 4 and SIP toolbox. Also, thanks to Dr. Soriano and her blog for sharing the additional code in linking SIP to Scilab 4.
For this activity I give myself a 10. 🙂
References:
Green Theorem: http://mathworld.wolfram.com/GreensTheorem.html
Pyramid of Giza: http://www.world-mysteries.com/mpl_2.htm


